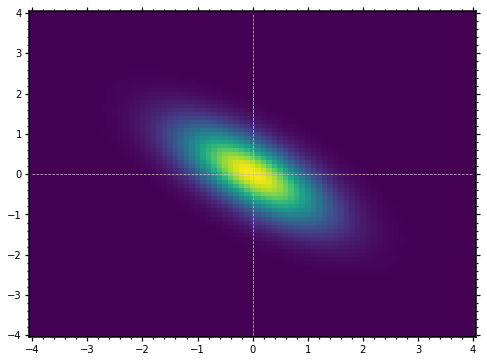
fig, ax = plt.subplots(figsize=(8, 6))

x, y = np.meshgrid(phaseSpace, phaseSpace)
ax.pcolormesh(y, x, wignerFunc)
ax.plot(phaseSpace, [0 for i in phaseSpace], color='silver', linestyle="--", linewidth='0.75')
ax.plot([0 for i in phaseSpace], phaseSpace, color='silver', linestyle="--", linewidth='0.75')

ax.set_xticks([-4, -3, -2, -1, 0, 1, 2, 3, 4])
ax.set_yticks([-4, -3, -2, -1, 0, 1, 2, 3, 4])

ax.yaxis.set_minor_locator(tck.AutoMinorLocator())
ax.xaxis.set_minor_locator(tck.AutoMinorLocator())

ax.tick_params(direction='out', which='both')
ax.tick_params(bottom=True, top=True, left=True, right=True, which='both')

ax.tick_params(length=4, width=1.25)
ax.tick_params(length=2, width=1.25, which='minor')

for axis in ['top','bottom','left','right']:
    ax.spines[axis].set_linewidth(1.5)
plt.show()